Probability Wheel Activities: 5 Lessons
By YesNoWheelApp · Reviewed by the founder ·
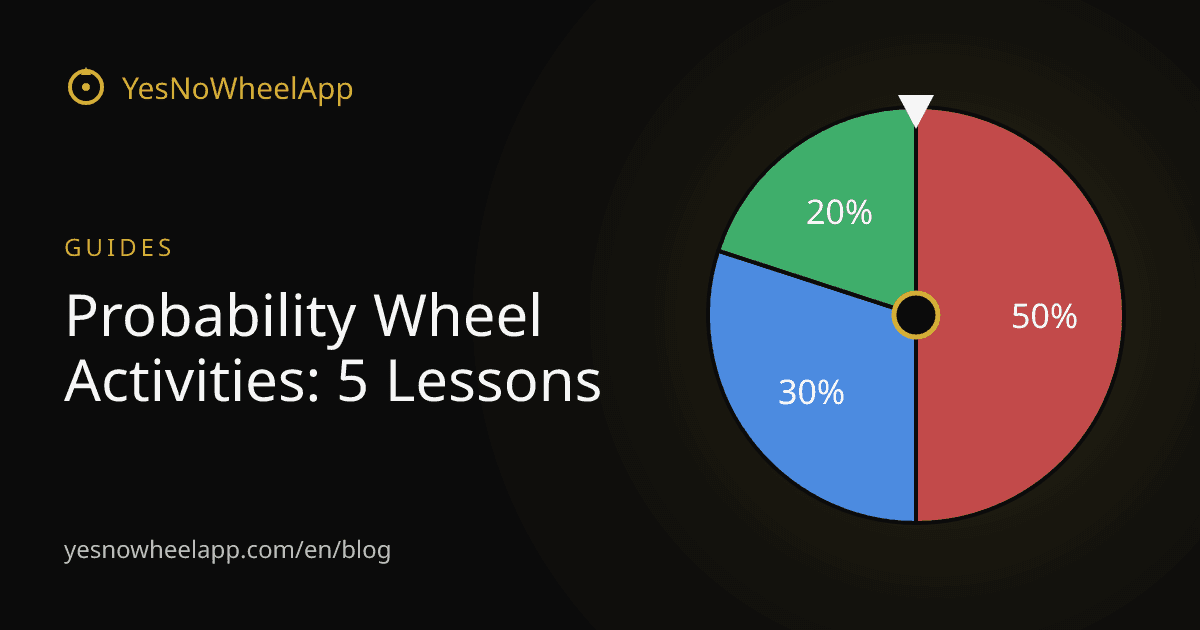
Five ready-to-run probability wheel lessons for a projected percentage spinner, each with a setup, a record sheet and an answer key. Use them to teach experimental versus theoretical probability, "at least once", fair games, expected value and streaks.
A probability spinner you can project has one big advantage over dice and coins: you set the odds. A 20% outcome, a 1-in-6 outcome or a lopsided game can each be on the board in under a minute, and the same wheel can run 1,000 trials instantly when hand-recorded data runs out of time.
Each activity below uses the percentage spinner and gives you the setup, what students record, an answer key with exact numbers, and a question to end on. They work as five separate lessons or as stations, and the same chance wheel handles any odds you type in.
Setting Up the Probability Wheel for All Five
- Percentages mode (the default) lets you type a value from 1 to 100 next to each outcome. Values are shares of the total, so they don't have to add up to 100. Weights mode runs the same math with a different label. Rename an outcome by editing its name in the Options tab (on a phone, press Edit to open the panel).
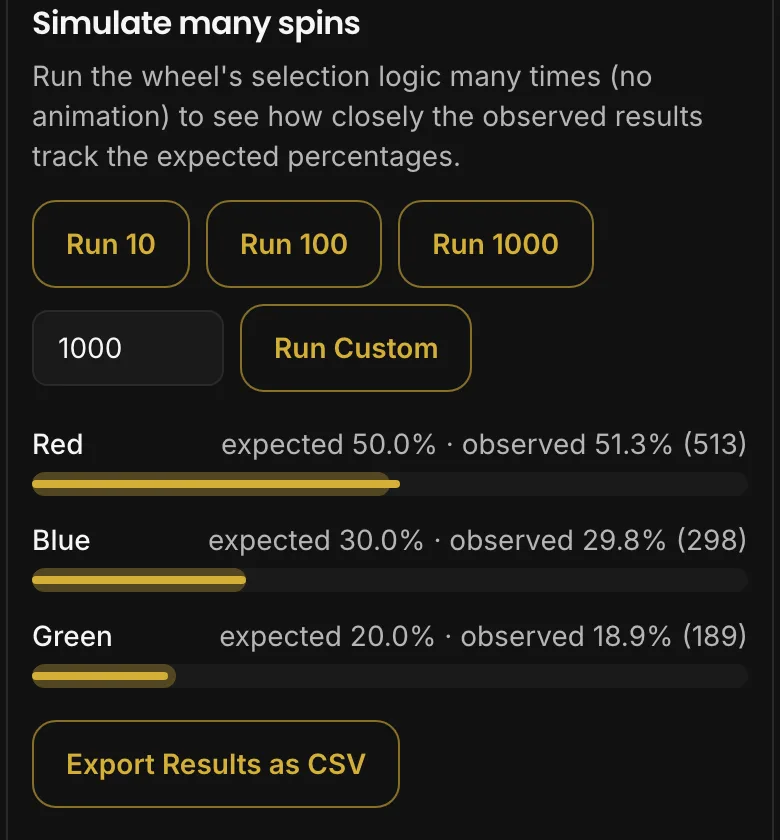
- The Odds tab holds the three panels used below: Simulate many spins (Run 10, Run 100, Run 1000, or Run Custom up to 100,000, with no animation), Chance of landing at least once, and Your spins so far (a tally of real spins).
- For real spins in front of the class, set Spin speed under the wheel to Quick (1.5 seconds) and press Space or Enter to spin. A student calling out results while another records keeps things moving.
1. Experimental vs. Theoretical Probability: 10, 100, 1,000 Spins
Setup. Percentages mode with three outcomes: Red 50, Blue 30, Green 20.
Students record. Before any spin, the theoretical probability of each color as a fraction and a percent. Then, in the Odds tab, press Run 10, Run 100 and Run 1000 and copy the observed count and observed % for each color into a table. Have each group do all three runs so the class ends up with several results for each size.
| Run size | Green count | Green % | Off from 20% by |
|---|---|---|---|
| 10 | |||
| 100 | |||
| 1000 |
Answer key.
- Theoretical: Red 1/2 = 50%, Blue 3/10 = 30%, Green 1/5 = 20%.
- Expected Green counts: 2, 20, 200.
- How close should results be? The chance that Green's observed share lands within 2 percentage points of 20% (18% to 22%) is 30.2% at 10 spins (only exactly 2 greens qualifies), 46.8% at 100 spins (18 to 22 greens) and 89.5% at 1000 spins (180 to 220 greens).
- At 10 spins, a run with no Green at all happens 10.7% of the time. In a class of ten groups, one zero-Green run is about what you'd expect.
- The typical spread (one standard deviation) of the Green count is about 1.3 at 10 spins, 4 at 100 and 12.6 at 1,000. As a percentage that's 12.6, 4.0 and 1.3 points.
Show the numbers
| Spins | Run 1 Green % | Run 2 Green % | Run 3 Green % |
|---|---|---|---|
| 10 | 10% | 20% | 10% |
| 20 | 20% | 15% | 15% |
| 30 | 13.3% | 16.7% | 20% |
| 50 | 10% | 18% | 22% |
| 75 | 9.3% | 25.3% | 22.7% |
| 100 | 10% | 24% | 24% |
| 150 | 12% | 23.3% | 22% |
| 200 | 13.5% | 23% | 23% |
| 300 | 16.3% | 22.3% | 20.3% |
| 500 | 16.6% | 21.6% | 19.4% |
| 750 | 19.6% | 21.9% | 19.3% |
| 1000 | 19.8% | 21.8% | 19.8% |
Discussion question. "At 1,000 spins the Green count is usually further from 200 than it was from 20 at 100 spins, yet the percentage is closer. How can both be true?" (The spread of the count grows with the square root of the number of spins, while the number of spins itself grows faster, so the percentage tightens.)
2. "At Least Once" Isn't "Add the Chances"
Setup. Percentages mode: Happens 1, Doesn't happen 5. That's a 1-in-6 chance, the same as rolling a six on a die.
Students record. First a prediction: "If I spin six times, what's the chance Happens comes up at least once?" Many students will say 100%, reasoning that 6 × 1/6 = 1. Then each student, or pair, does six real spins and writes yes or no: did Happens appear at least once? Pool the class results as a fraction.
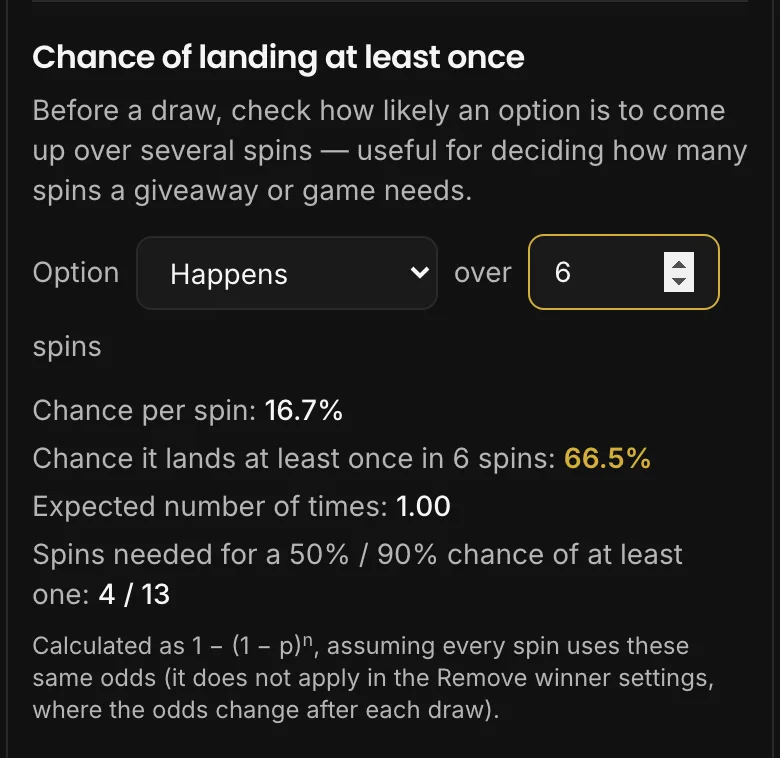
Then open Chance of landing at least once in the Odds tab, choose Happens, and enter 6 spins.
Answer key.
- Chance of at least one Happens in 6 spins: 1 − (5/6)6 = 66.5%. In a class of 24, expect about 16 students to say yes.
- The calculator's Expected number of times line shows 1.00 for the same setup. That's where the "6 × 1/6" intuition comes from. It's the average count, not the chance of at least one.
- Spins needed for a 50% / 90% chance of at least one: 4 / 13.
- Other values to try: 10 spins gives 83.8%, 20 spins 97.4%.
- Extension with the 1 in 100 happens button (in the More tab, under "Will it happen?"): 100 spins give only 63.4%. An even chance takes 69 spins, a 90% chance 230.
Show the numbers
| Spins | Chance of at least once |
|---|---|
| 1 | 16.7% |
| 2 | 30.6% |
| 3 | 42.1% |
| 4 | 51.8% |
| 5 | 59.8% |
| 6 | 66.5% |
| 7 | 72.1% |
| 8 | 76.7% |
| 9 | 80.6% |
| 10 | 83.8% |
| 11 | 86.5% |
| 12 | 88.8% |
| 13 | 90.7% |
| 14 | 92.2% |
| 15 | 93.5% |
| 16 | 94.6% |
| 17 | 95.5% |
| 18 | 96.2% |
| 19 | 96.9% |
| 20 | 97.4% |
| 21 | 97.8% |
| 22 | 98.2% |
| 23 | 98.5% |
| 24 | 98.7% |
Discussion question. "A game app says an item has a 1% drop rate. Someone has played 100 rounds without getting it. Is the app broken?" (No: 1 − 0.99100 means about 36.6% of players go 100 rounds without it.)
3. Fair and Unfair Games
Setup. Weights mode, two outcomes: Player A 1, Player B 3 (25% / 75%).
Rules, Game 1: each spin, A scores 3 points if the wheel lands on A, and B scores 1 point if it lands on B.
Students record. Pairs play 30 real spins, keeping a running score, and write down the final score and who was ahead. Collect every pair's result on the board. Then ask: is the game fair?
Answer key, Game 1.
- Expected points per spin: A = 0.25 × 3 = 0.75, B = 0.75 × 1 = 0.75. The game is fair even though B wins three spins out of four.
- After 30 spins, A is ahead 48.6% of the time and B 51.4%. A tie is impossible: the gap is always 4 × (A's wins) − 30, which is never zero.
- The gap is wide even in a fair game: its standard deviation over 30 spins is about 9.5 points, and the leader is 10 or more points ahead 39.9% of the time. Expect several pairs to be convinced the game is rigged.
Game 2: set up Percentages mode with A 30 and B 70. A scores 2 points, B scores 1.
- Expected points per spin: A = 0.6, B = 0.7. Unfair, in B's favor.
- Over 30 spins: B ahead 58.9%, tie 14.2%, A ahead 27.0%.
- Fix it without changing the points: A needs p with 2p = 1 − p, so p = 1/3. In either mode that's A 1, B 2: the values are shares of the total, so 1 and 2 give exactly 1/3. Over 30 spins the fixed game gives A ahead 41.5%, tie 15.3%, B ahead 43.2%.
To check with larger numbers, Run 1000 in the Odds tab and compute each player's points from the observed counts. In Game 1, both totals should come out near 750.
Discussion question. "Is a game unfair if one player wins most of the spins?" (Not necessarily. Fairness compares expected points, not how often each player wins a spin.)
4. Expected Value of a Prize Wheel
Setup. A fundraiser booth charges $1 a spin. Percentages mode: $5 → 5, $2 → 15, $1 → 30, No prize → 50.
Students record. First, each student calculates the expected payout per spin by hand. Then Run 1000 in the Odds tab, record the four observed counts, and work out the total paid out and the booth's profit on $1,000 of spins.
Answer key.
- Expected payout per spin: 5(0.05) + 2(0.15) + 1(0.30) + 0(0.50) = $0.85. The booth keeps 15¢ per spin on average.
- Expected counts in 1,000 spins: 50, 150, 300, 500, so the expected payout is $850 against $1,000 taken.
- The short run is riskier for the booth than the average suggests. The exact chance that the booth pays out more than it takes in is 24.3% over 20 spins (expected profit $3.00), 17.0% over 50 spins ($7.50) and 4.0% over 200 spins ($30.00).
- A fair price for this wheel is $0.85. To make it fair at $1 instead, change the $5 slice to 8 and No prize to 47: the expected payout becomes exactly $1.00.
Discussion question. "Why can a game with a negative expected value for players still lose the booth money on a slow afternoon?"
5. Streaks and the "Law of Small Numbers"
Setup. Percentages mode. In the More tab, press 50% happens to load Happens 50, Doesn't happen 50.
Students record.
- Without the wheel, each student writes a sequence of 20 H and D that "looks random".
- Then 20 real spins at Quick speed, recording each result in order. The simulation only reports totals, so the order has to be written down by hand.
- For both sequences, record the longest run (most identical results in a row) and the number of switches (times the result changes from one spin to the next).
Answer key (for 20 spins of a 50/50 wheel):
- Expected number of switches: 19 × ½ = 9.5.
- Longest run of 4 or more: 76.8%. 5 or more: 45.8%. 6 or more: 23.7%. Only 2.1% of real sequences have no run longer than 2.
- Average longest run: about 4.7.
- It's common for invented sequences to switch more often than 9.5 times and to avoid runs of 4 or more. Real sequences usually contain a run that "looks suspicious". Comparing the two columns on the board tends to make the point without any explanation.
The classic reference is Tversky and Kahneman's paper "Belief in the Law of Small Numbers" (Psychological Bulletin, 1971), which describes people expecting small samples to look like the probabilities that produced them.
Discussion question. "After four Happens in a row, is Doesn't happen more likely on the next spin?" (No. The wheel's odds are the same on every spin. The Your spins so far tally will drift back toward 50% over many spins, but no single spin "corrects" the streak.)
Running the Activities: Quick Answers
Can every student run the activities on their own device?
Yes. Each browser runs its own wheel, with no account or class code. The simulation results differ from device to device, which is useful for Activity 1: each group's run is a separate sample.
Can I save the setups so I don't retype them each lesson?
In the More tab, name the wheel and press Save Wheel. Up to 20 named wheels stay in that browser. To give students the same wheel, use the share link instead, which carries the outcomes and their values.
Does the simulation use the same randomness as a real spin?
Yes. Simulate many spins calls the same pick function as the animated spin, just without drawing the wheel. How that randomness is generated is explained on the How It Works page.
Related Decision Tools
Percentage Spinner
Set the odds, then simulate up to 100,000 spins in the Odds tab.
Weights mode
Whole-number weights for odds like 1 in 3.
Names mode
Pick who reports next; each name leaves the wheel.
Related Articles
Wheel of Names With Percentages
Set up a weighted name wheel: turn tickets into percentages, paste "Name, weight" lists, and see exactly how the odds shift when each winner is removed.
Provably Fair Giveaway: Run One on Stream
Run a stream giveaway viewers can check: post a hash before the draw, take a word from chat, then share a proof link anyone can recompute. Worked example inside.
Never Have I Ever Questions: 105 by Category
105 Never Have I Ever questions in five categories: adults, clean, family-friendly, couples and any group, with notes on running the game with new groups.
Would You Rather Questions for Couples (55)
55 Would You Rather questions for couples in five sets: romantic, deep, flirty, funny and long-term, for date nights and partners with shared history.